
Built for distilleries first.
Ready for wineries too.
DepletionIQ speaks both fluently out of the box. Each category gets purpose-built fields, reporting, and language, not a generic dashboard with the labels swapped.
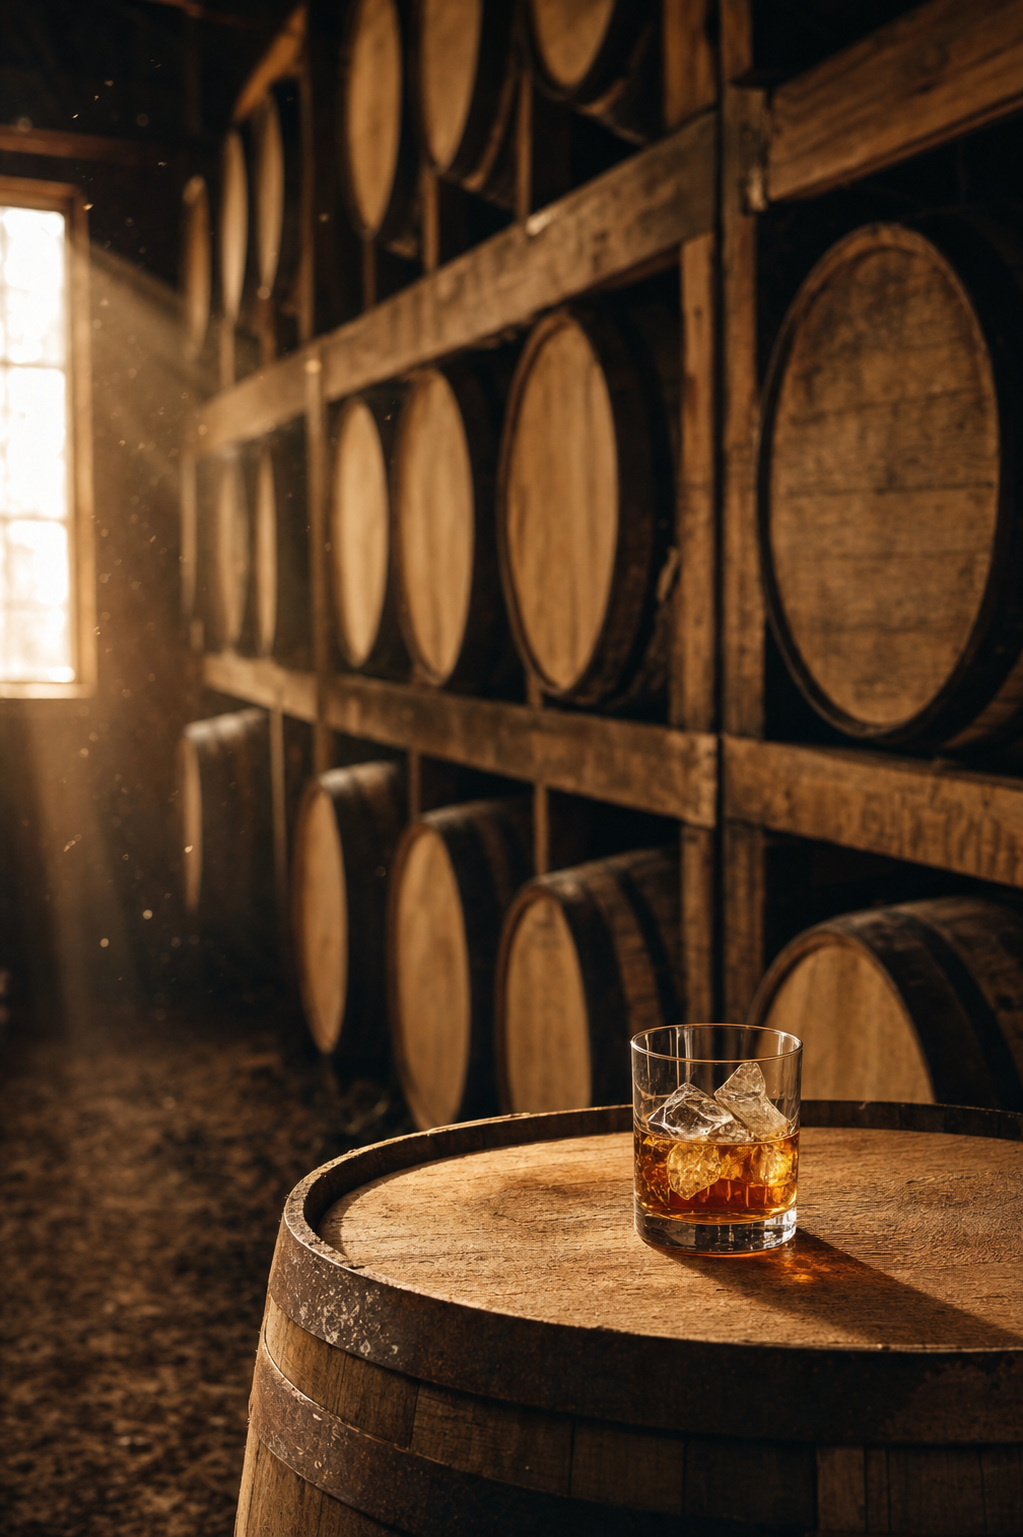
Every barrel picked.
Every case followed.
Your brand's success depends on what happens after the distributor takes possession. DepletionIQ tracks every SKU from your distributors into liquor stores, restaurants, bars, and other licensed accounts — showing you exactly where products are selling, where they are slowing down, and where your sales team needs to take action.
- Account-level tracking for liquor stores, restaurants, and bars
- SKU performance by distributor, territory, and location
- New placement and inactive-account identification
- Inventory movement, sales trends, and reorder opportunities
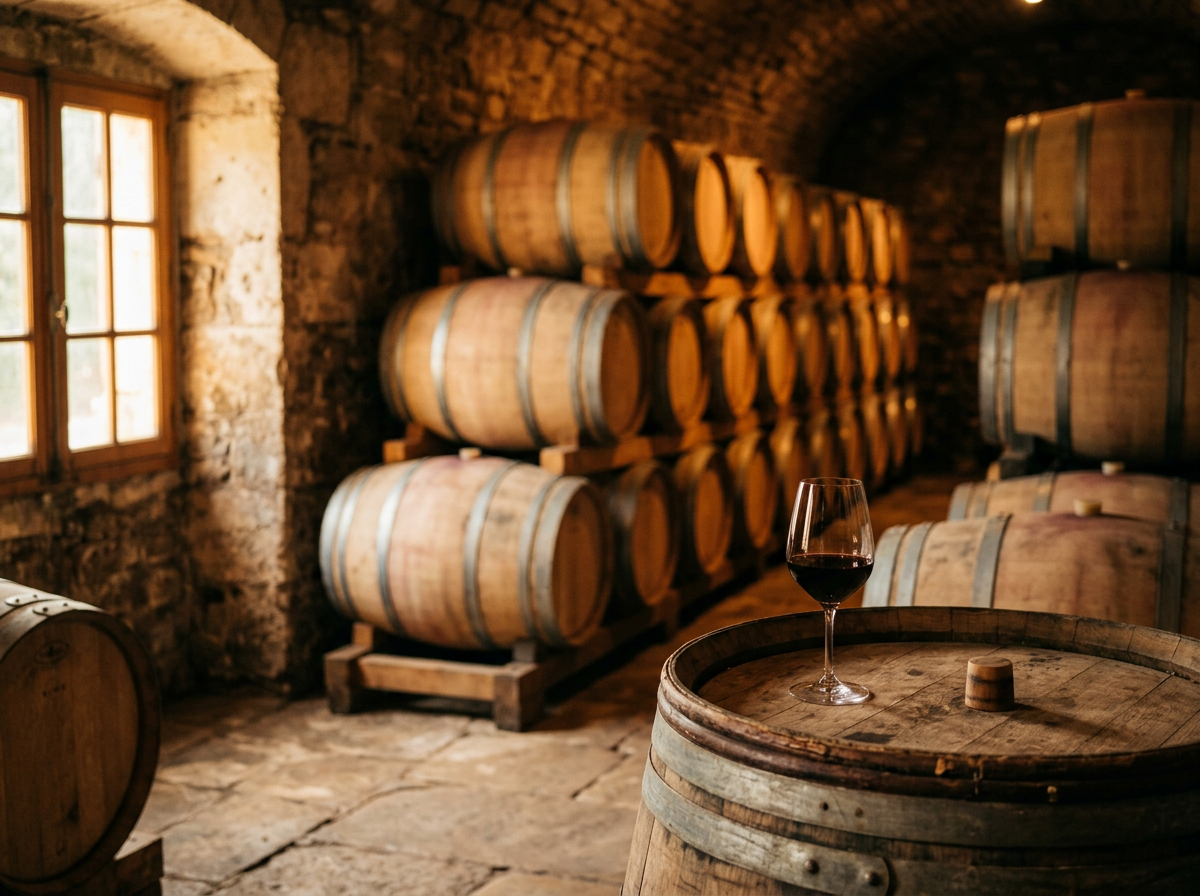
See past the tasting room. All the way to the shelf.
Your DTC dashboard is beautiful. Your wholesale one is a PDF from a distributor rep. DepletionIQ closes that gap — tracking vintage-level depletions across restaurants, wine bars, and independent bottle shops so you know which vintage is aging in the wrong cellar.
- Vintage-level SKU tracking across releases
- By the bottle vs by the case segmentation
- Somm-driven placement velocity tracking
- Multi-state DTC compliance overlay