Five states. Five formats. No standard.
Like most craft producers, this southwest Kentucky distillery got its sales data the way distributors send it. Reports from five states arrived as a mix of CSV files and Excel spreadsheets, each in its own layout, on its own schedule. Some covered purchase orders, some covered depletions, some covered both.
There is no industry-wide standard for how a distributor reports depletions, and it showed. One house spelled out the full product name on every line. Another used its own abbreviations. One color-coded the cells — the meaning lived in the fill color, not in any column a spreadsheet could sort. The same bottle could appear three different ways across three files, and none of them agreed on how to name an account either.
| Item | Cases |
|---|---|
| Kentucky Straight Bourbon Whiskey 750ml | 12 |
| Kentucky Straight Rye Whiskey 750ml | 6 |
| Single Barrel Bourbon 750ml | 3 |
| SKU | Qty |
|---|---|
| KSBW-750 | 12 |
| KSRW-750 | 6 |
| SB-BRBN-75 | 3 |
| Product | Cs |
|---|---|
| Bourbon | 12 |
| Rye | 6 |
| Bourbon | 3 |
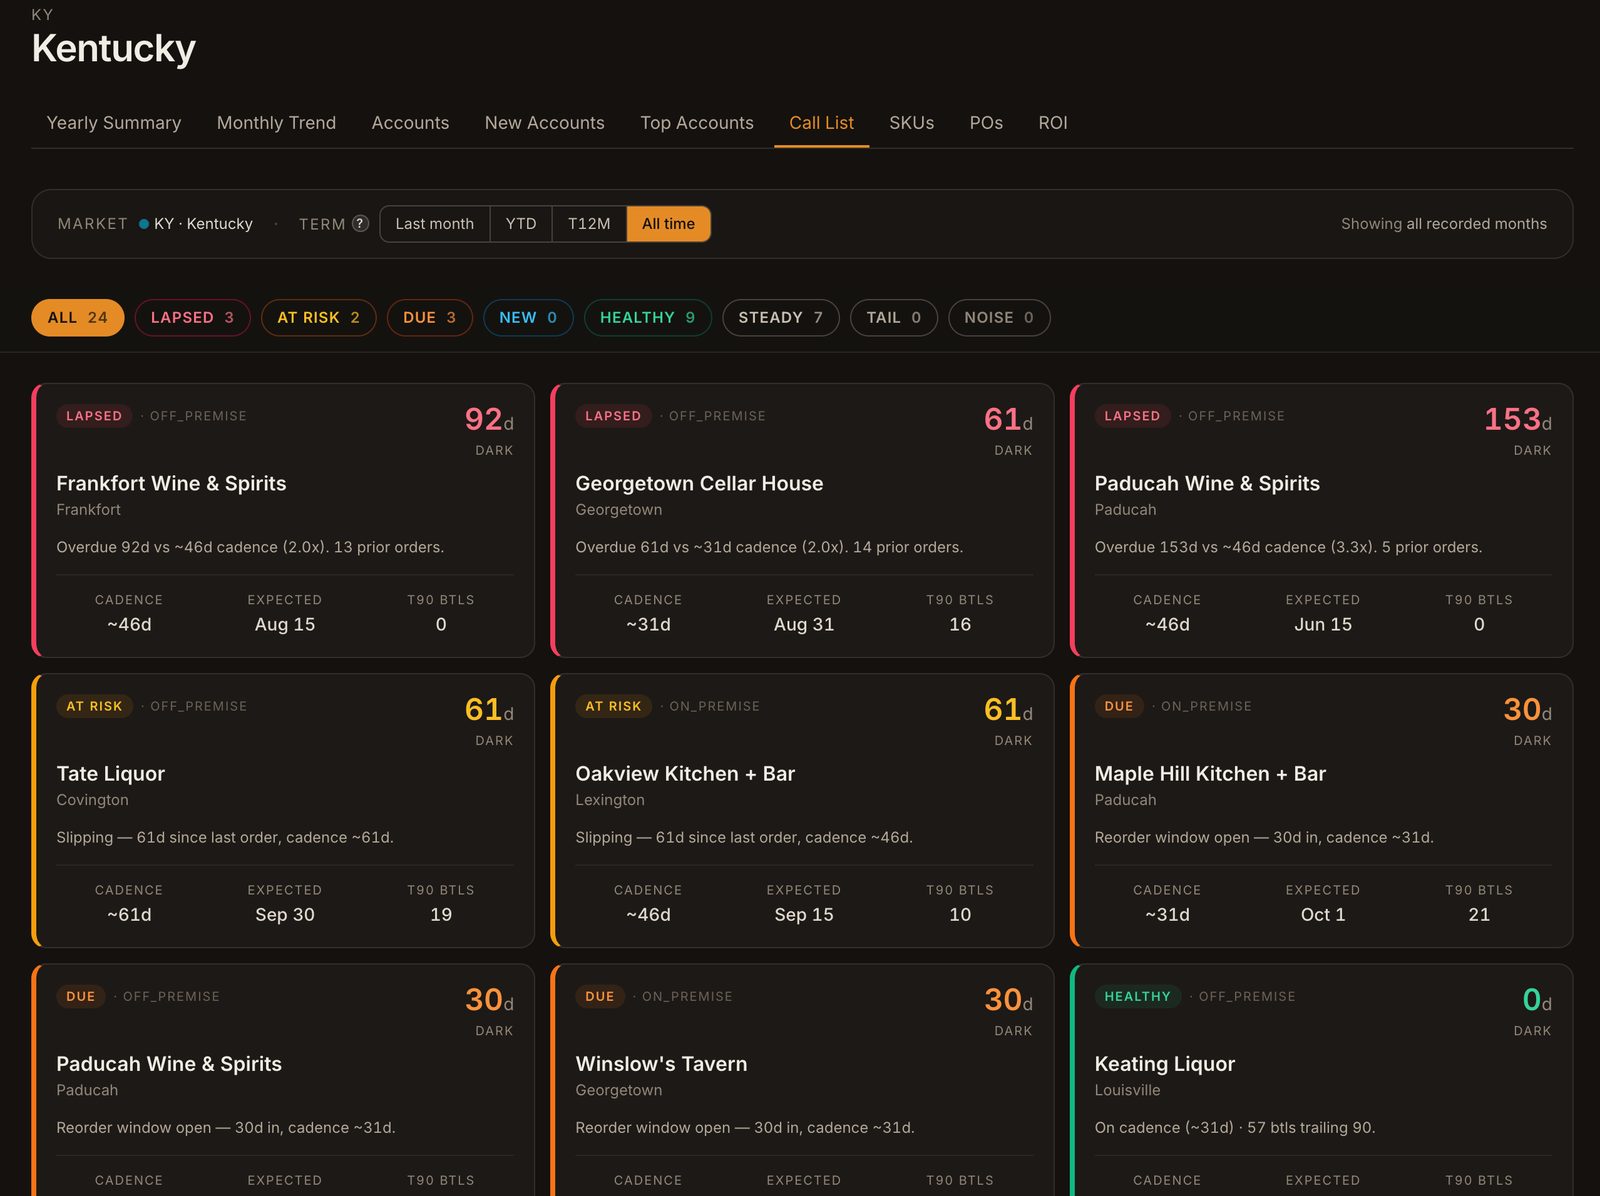
Because every file was a one-off, nobody was combining them. No one on the team had the hours to normalize a random CSV against a random spreadsheet, so the files landed in inboxes and stayed there, and no one ever saw the full picture. Ownership and the distill master were making calls about production, promotions and where to spend their time with, at best, a gut feel for what was actually moving.
It also made the monthly distributor call a one-sided conversation. The distributor came in knowing exactly what had moved, what hadn't and what they wanted next. The distillery came in with a stack of files it hadn't been able to read. There was no way to challenge a number, ask why a state had gone quiet, or point to an account that deserved more attention — you can't negotiate with data you don't have.
The questions weren't exotic. Where is our inventory right now? What's the life cycle of a case once it leaves the rickhouse? Which states are pulling their weight? Did that tasting actually lead to a reorder? They just had no single place to get answered.
One picture, built from the data they already had.
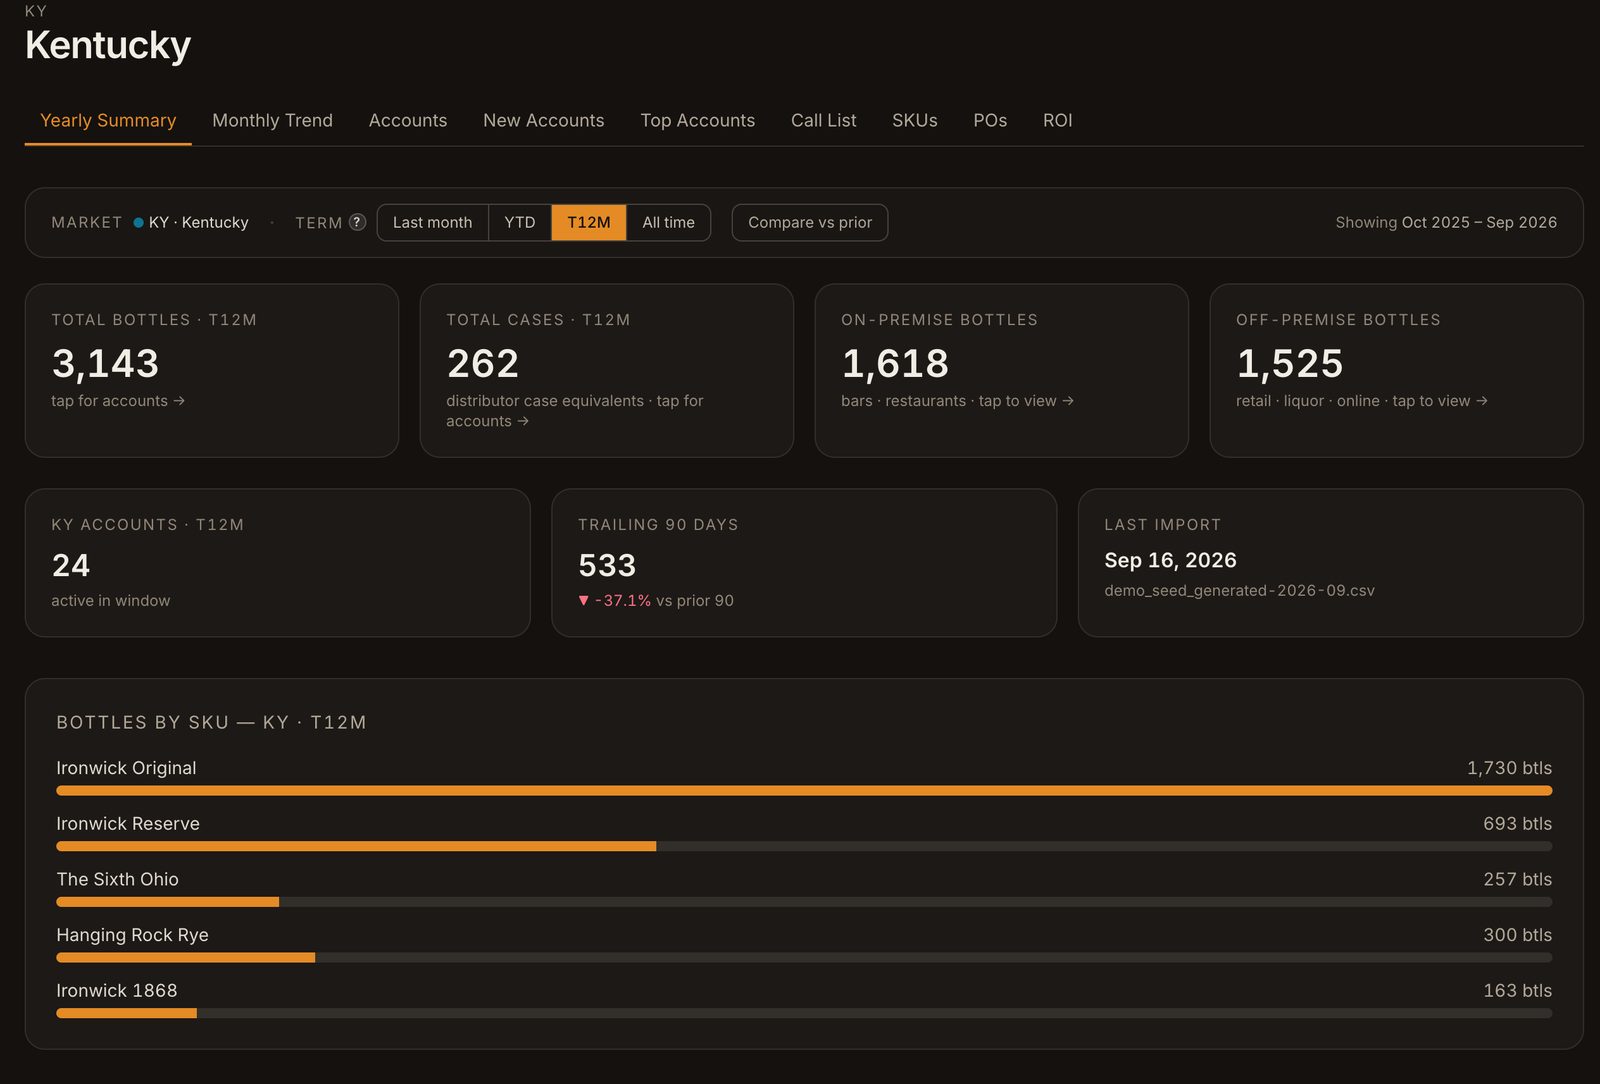
This distillery was the first live deployment of DepletionIQ. We took the same spreadsheets the distributors were already sending, normalized them across every house and every state, and put the result in front of the owner and the distill master as a live dashboard. Nothing to install, no new reports to request from anyone — the data was theirs all along; it just hadn't been legible.
Once the picture existed, the team could stop guessing and start reading. Here is what became visible for the first time.
-
Where the inventory actually was
Cases at the distributor, cases sitting at retail, and cases already depleted — separated for the first time, per state and per account.
-
The life cycle of a bottle and a case
How long product took to move from purchase order to shelf to sold, so the team could see the real pace of sell-through rather than the pace of shipments.
-
Which states were producing
Five states, side by side: how many cases each was depleting and how online sales in each compared with what the distributor channel was moving.
-
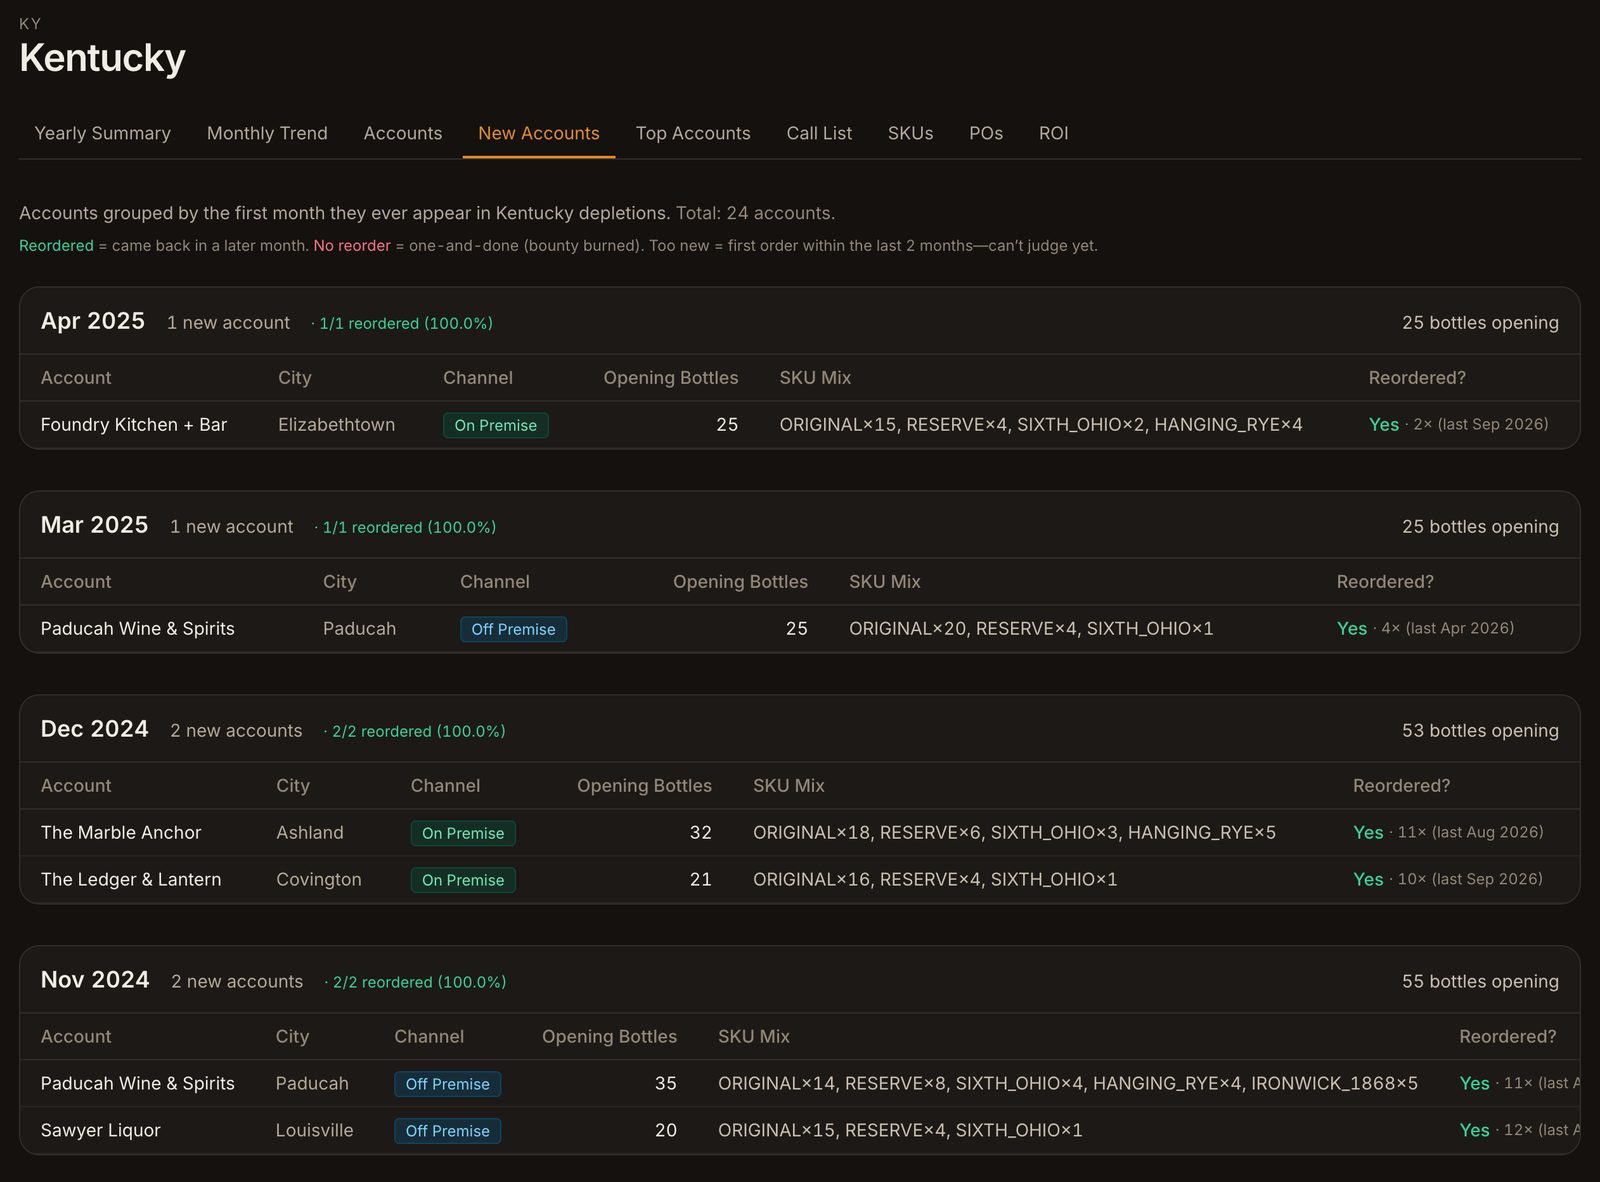
Whether promotions were working
Which distributors and accounts engaged with a promotion — and, more tellingly, which ones never placed a reorder afterward. A tasting that doesn't turn into a second order is a cost, not a win, and now it showed.
-
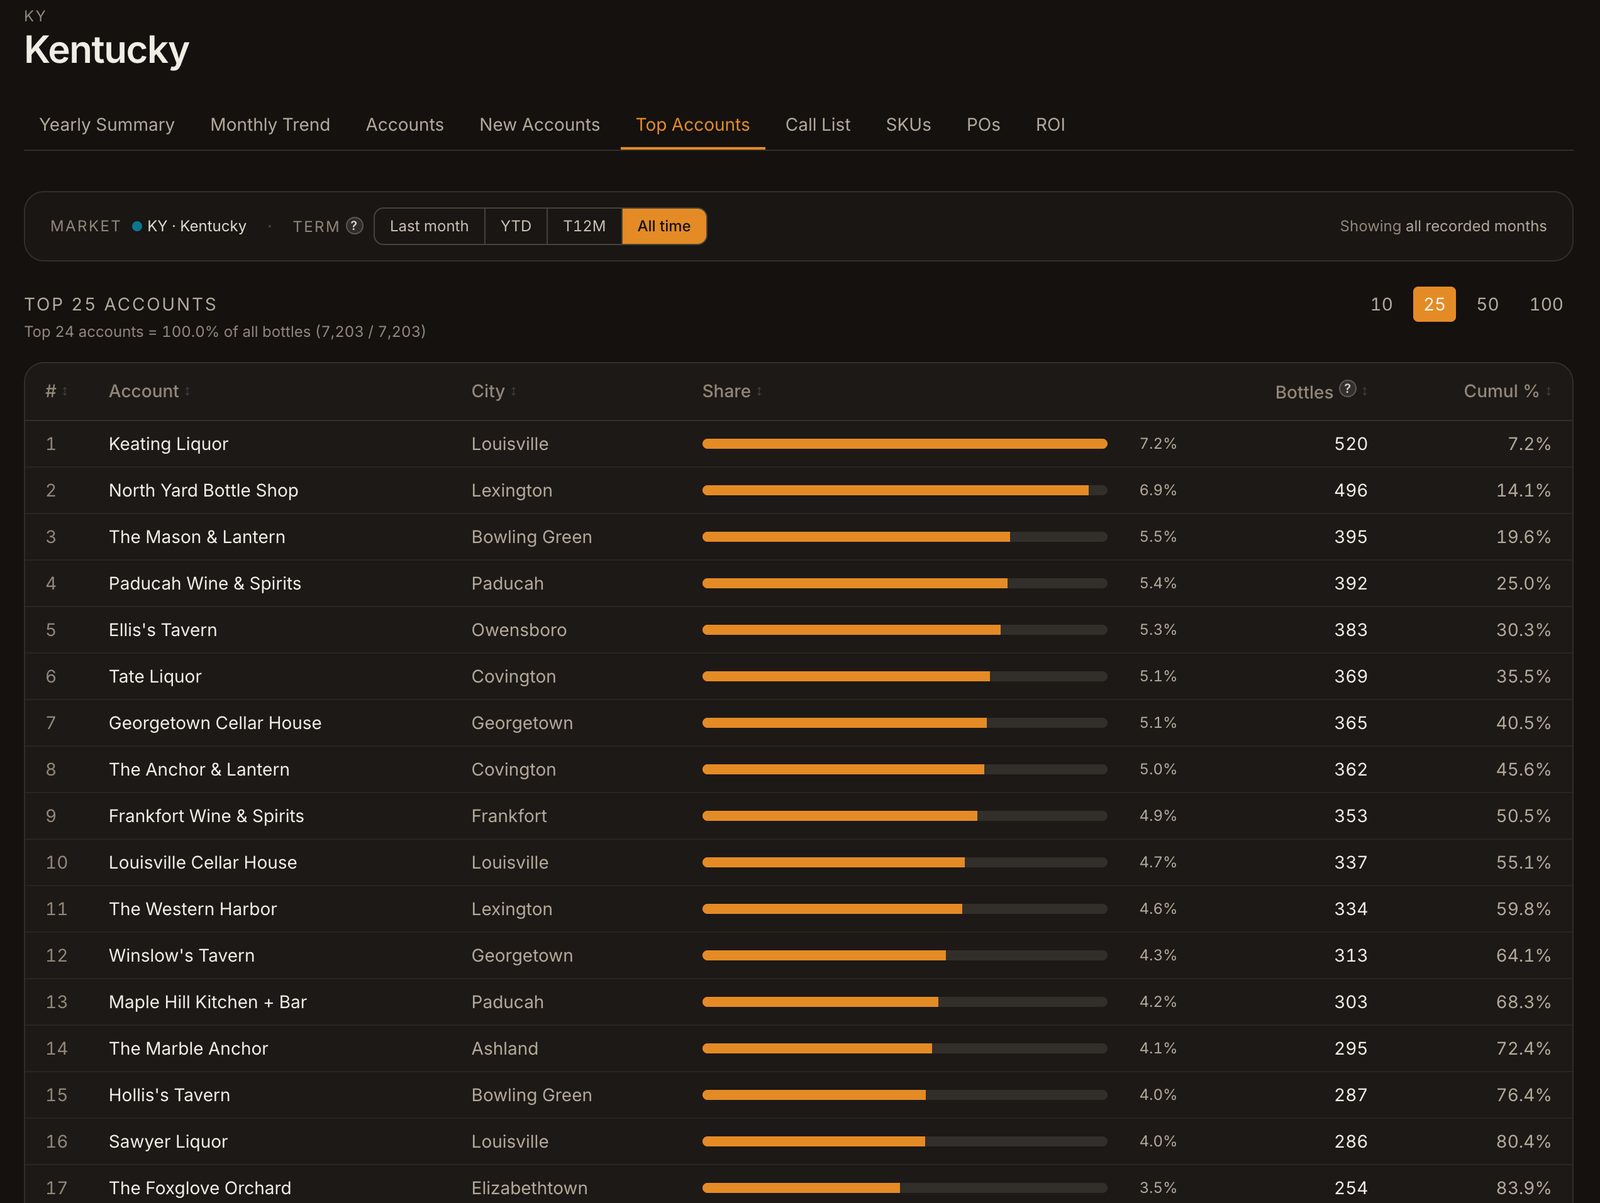
Top accounts — and how concentrated they were
The best-performing accounts across every state, ranked, with a clear read on whether too many of the distillery's eggs were in one basket instead of spread across the map.
The data made the production call.
The most consequential thing DepletionIQ surfaced was the gap between what the distillery was producing and what was actually selling through. With current inventory levels laid against real online and distributor performance across the five states, the direction was hard to argue with.
Ownership and the distill master reduced the production run — based on live inventory and actual sell-through, not on a hunch.
Directional by design: figures are withheld at the customer's request. The decision, and the fact that the data alone drove it, are the point.That's the shift in one sentence. The same spreadsheets that had been ignored for months became the basis for a capital decision — because for the first time someone had put them in a form a busy owner could read in a minute.
The monthly distributor call changed too. Walking in with the same numbers the distributor had — and some they didn't, like which accounts went quiet after a promotion — turned a briefing into a two-sided conversation. The distillery could ask about a specific state, a specific account, a specific reorder that never came, and expect an answer.
Customer details have been anonymized at their request. Performance figures are described directionally.